[NOTE] Go Profiling and Observability from Scratch
[NOTE] Go Profiling and Observability from Scratch⌗
Agenda⌗
- Scheduling & Memory Management: A simple model
- Profiling: CPU, Memory, Mutex, Block, Goroutine + Overhead Benchmarks
- Tracing: Manually, Distributed, Runtime
- Metrics: Runtime Metrics
- 3rd party Tools: Linux perf, BPF, Delve,fgprof
Scheduling & Memory Management⌗
- Go’s primary job is to multiplex and abstract hardware resources
- Very similar to an operating system, - it’s turtles all the way down
- Following model recap for some, but perhaps more useful than more complex models usually presented.
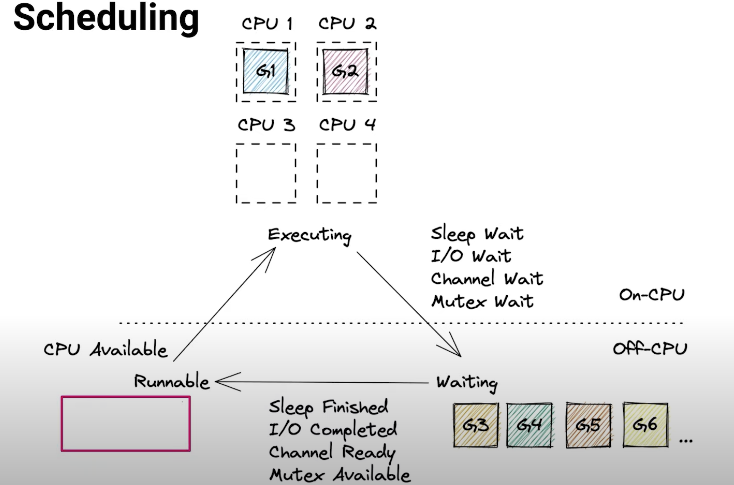
Scheduling⌗
- Go schedules goroutines onto CPUs (OS Threads)
- Deeply integrated with networking, channels and mutexes
- Scalable to hundred of thousands of goroutines
Memory Management⌗
- Small stack per goroutine (4kB+)
- Big heap, needed for shared data and other reasons
- Stack allocation is very cheap
- Heap allocation and GC is expensive (20%+ CPU Time common)
- Reduce: Turn heap into stack allocs or avoid completely
- Reuse: Reuse heap allocations like structs and buffers
- Recycle: Some GC work is inevitable, it’s okay
- Reducing heap allocs speed up unrelated code (GC thrashes CPU Caches)
Memory Management: Heap⌗
- Referenced Allocation (In-Use)
- Unreferenced Allocation (Garbage)
Profiling⌗
CPU Profiler⌗
- Captures: On-CPU time of your code by interrupting the process after every 10ms of CPU Time to take a stack trace.
- Profile Data: Sample count and time spent per stack trace
- Sample Rate: runtime.SetCPUProfileRate(hz)
CPU Profiler: SIGPROF for every 10ms of CPU Time⌗
// go 1.17.3 src/runtime/signal_unix.go
func setProcessCPUPROFILER(hz int32) {
  if hz != 0 {
    // Enable the Go signal handler if not enabled.
    if atomic.Cas(&handlingSig[_SIGPROF], 0, 1) {
      atomic.Storeuintptr(&fwdSig[_SIGPROF], getsig(_SIGPROF))
      setsig(_SIGPROF, funcPC(sighandler))
    }

    var it itimerval
    it.it_interval.tv_sec = 0
    it.it_interval.set_usec(1000000 / hz)
    it.it_value = it.it_interval
    setitimer(_ITIMER_PROF, &it, nil)
  } else {...}
}

func sighandler(sig uint32, info *siginfo, ctxt unsafe.Pointer, gp *g) {
  _g_ := getg()
  c := &sigctxt{info, ctxt}
  if sig == _SIGPROF {
    sigprof(c.sigpc(), c.sigsp(), c.siglr(), gp, _g_.m)
    return
  }
  // ...
}
CPU Profiler: Add Stacktrace to Profile⌗
// go 1.17.3 src/runtime/proc.go
const maxCPUProfStack = 64
func sigprof(pc, sp, lr uintptr, gp *g, mp *m) {
  // ...
  var stk [maxCPUProfStack]uintptr
  // ...
  n := gentraceback(pc, sp, lr, gp, 0, &stk[0], len(stk), ...)
  // ...
  cpuprof.add(gp, stk[:n])
}
CPU Profiler: Waiting for Go 1.18⌗
- setitimer(2) fails to deliver more than 250 signals per second, biases profile to underestimate CPU Spikes, see GH #35057
- Go 1.18 patch from Rhys Hiltner will fix this and thread bias issues such as GH #14434 by using timer_create(2)
Block Profiler⌗
-
Captures: Off-CPU time waiting on channels and mutexes
-
But not: Sleep, I/O, Syscalls, GC, etc.
-
Profile Data: Cumulative contentions and delays per stack trace
stack trace contentions/count delay/nanoseconds main; foo;runtime.chansend1 22820 867549417 main; foo;bar;tuntime.chanrecv1 22748 453510869 main;foobar;sync.(*Mutex).Lock 795 5351086 -
Sample Rate: runtime.SetBlockProfileRate(rate)
Mutex Profiler⌗
-
Captures: Off-CPU time waiting on mutexes (not channels)
-
Profile data: Cumulative contentions and delays per stack trace
stack trace contentions/count delay/nanoseconds main; foo; sync.(*Mutex).Unlock 22820 867549417 main; foo;bar;sync.(*Mutex).Unlock 22748 453510869 main;foobar;sync.(*Mutex).Unlock 795 5351086 -
Rate: runtime.SetMutexProfileFraction(rate)
Block vs Mutex⌗
- Block seems like a superset of mutex profile, but it’s not:
- Mutex profile shows what code is doing the blocking
- Block profile show what code is getting blocked
- Both perspectives are useful, so enable both profilers
Quick Note on Time⌗
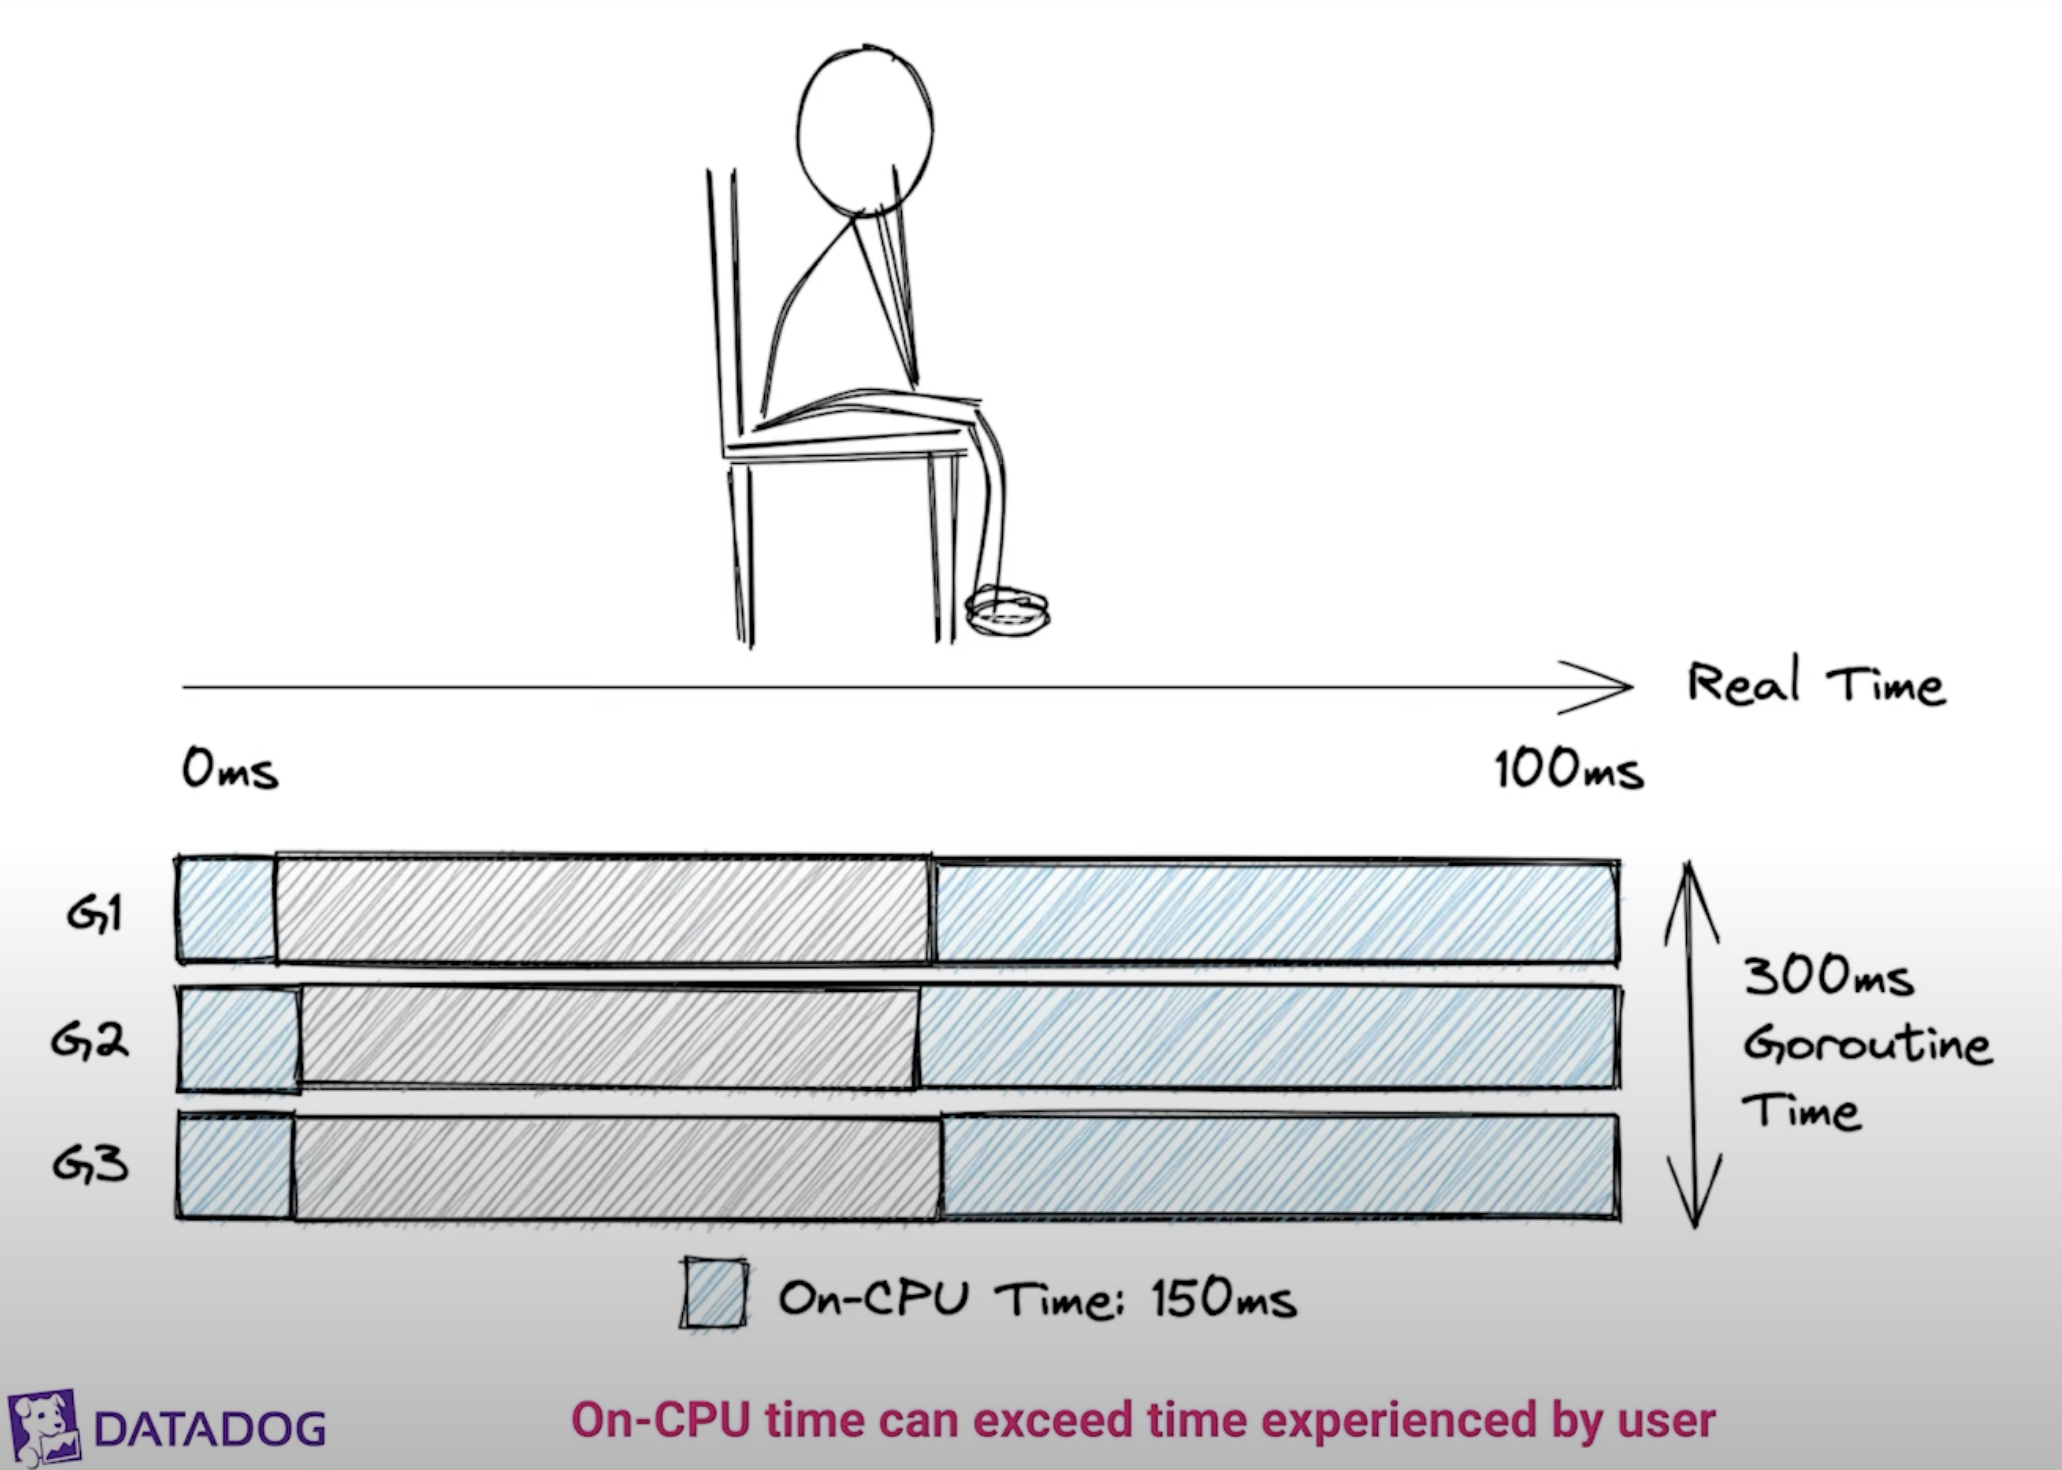
On-CPU Time > Real Time
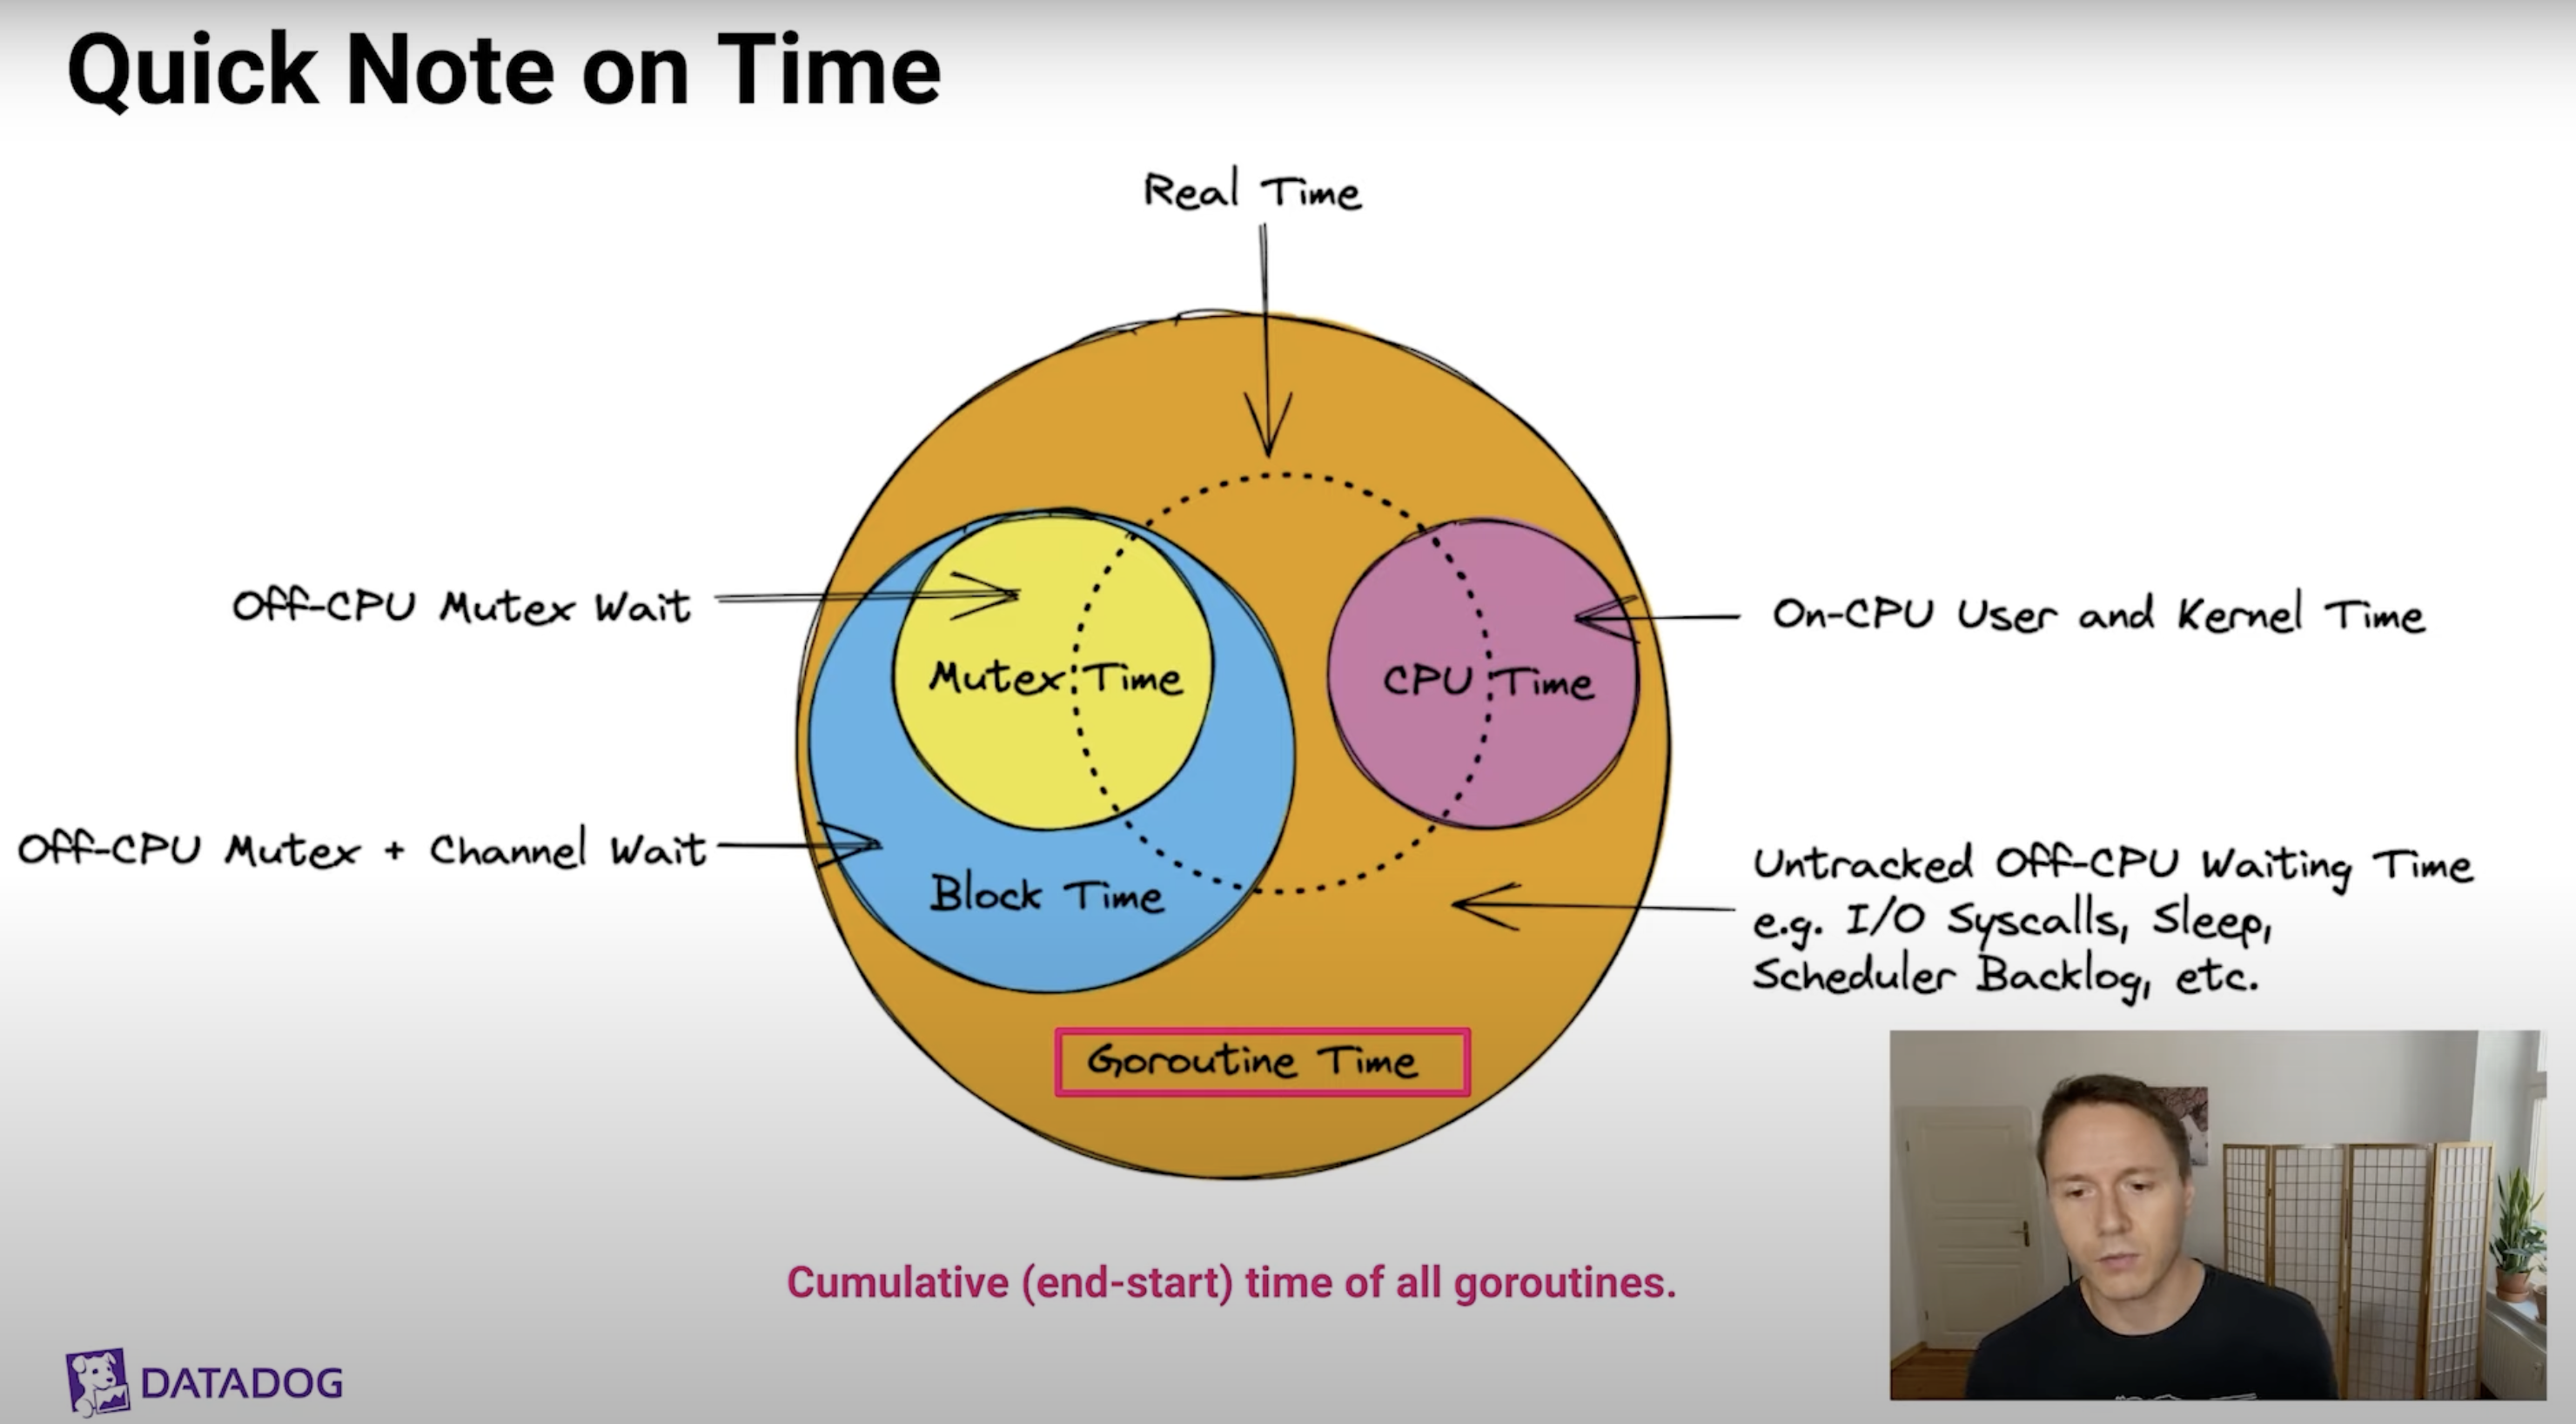
- Goroutine Time: Cumulative (end - start) time of all goroutines
- CPU Time: CPU tiem circle can be larger than Real time circle
- Mutex Time
- Block Time: Block time is a superset of mutex time (but with different call stacks)
- Untracked Off-CPU Waiting Time: Profiling Blindspot!
Memory Profiling⌗
-
Profile Data: Cumulative allocs and inuse per stack trace
stack trace alloc_objects/count alloc_space/bytes inuse_objects/count inuse_space/bytes main; foo 5 120 2 48 main;foo;bar 3 768 0 0 main;foobar 4 512 1 128 -
Samples captured every 512kB of malloc() and when those objects are free()’d by the GC later on (inuse = allocs - frees)
-
Sample Rate: runtime.memProfileRate = rate (default = 512kB)
func main() {
  user := &User{Name: "alice"}
  fmt.Printf("User: %v\n", user)
}
LEAQ type."".User(SB), AX
PCDATA $1, $0
NOP
CALL runtime.newobject(SB)
MOVQ $5, 8(AX)
LEAQ go.string."alice"(SB), CX
MOVQ CX, (AX)
Goroutine Profiling⌗
-
Profile Data: Goroutine count per stack trace
stack trace goroutine/count main;foo 5 main; foo;bar 3 main;foobar 4 -
O(N) Stop-The-World where N is the total number of goroutines (cause tail latency)
-
No Sampling Mechanism
-
Use Cases: Detect goroutine leaks and diagnose hanging programs(debug=2)
Tracing⌗
-
Tracing: Recording of time-stamped events
Distinction with logging can be muddy, depends on context
-
Distributed Tracing: Tracing requests through multiple services
Highly recommended to understand performance from system perspective
-
Runtime Tracing: Go’s built-in tracer
Can shine a light on profiling blindspots (e.g. I/O, Sleep, GC, Scheduler Backlog)
-
Tracing Profiler: Tracing every function call
Doesn’t currently exist for Go
Runtime Tracer⌗
-
Traces Scheduler, GC, Contentions, Syscall, etc.
see src/runtime/trace.go for a list of events
-
High-overhead firehose that produces a lot of data
-
But fantastic way to track down latency when nothing else seems to have the answer
Profiling and Tracing Overhead Analysis⌗
- Run different workloads in a loop for 1 minute with and without various profilers enabled, measure avg latency
- Repeat each experiment 5 times
- Performed on a AWS c5.4xlarge machine(6h total duration)
- This is hard! Early sneak peek, bad env, bad stats, naive workloads, do not trst too much!
Overhead Analysis: Error Sources⌗
- Dynamic frequency scaling (Turbo Boost)
- Noisy Nerghbors
- Human error
- Check for new results by the time you watch this
- But: Very low overhead for cpu, memory, mutex and block profiler for non-pathological workloads
Metrics⌗
-
Use runtime/metrics (Go 1.16+), highlights: (*mB ~ 100mB)
metric description /gc/pauses:seconds Stop-the-world pause latency histogram /sched/latencies:seconds Goroutines waiting in runnable state latency histogram /sched/goroutines:goroutines Number of live goroutines /memory/classes/heap/objects:bytes Current heap memory usage /memory/classes/heap/stacksbytes Current stack memory usage /memory/classes/profiling/buckets:bytes Memory used by internal profiling hash maps -
Recommendation: Capture all runtime/metrics
3rd Party Tools⌗
- Linux Perf
- bpftrace
- delve
- fgprof
Scheduling / Execution Observability⌗
- Profilers: CPU, Block, Mutex, Goroutine
- Tracing: Runtime Execution Tracer, Distributed Tracing
- Metrics: Scheduler Latency, Goroutine Count
- Compile Time: Function Inlining (go build -gcflags='-m')
Memory Management Observability⌗
- Profilers: Memory Profiler
- Tracing: Runtime Tracing (GC Events)
- Metrics: GC counters, GC pause times, Heap Stats, Stack Stats
- Compile Time: Escape Analysis (go build -gcflags='-m')
Recap⌗
- Go runtime offers great observability out of the box
- Most tools play nice with production workloads
- 3rd party tools and custom instrumentation can close the gaps